Polar vortex at 10 hPa is normally between -60c to -80c in August (you can see that in this attached shot). Latest EC is showing a large area over the South Pole above +0c including 4c. These are anomalies like I have never seen before on any chart.

Welcome New Members! We want to hear from you. Register, stop lurking and start posting!
Climate Driver Discussion 2019 (Enso, IOD, PDO , SAM)
- JasmineStorm
- Supercell
- Reactions:
- Posts: 1870
- Joined: Thu Sep 22, 2016 9:40 pm
- Location: Kyneton 527 ASL
Re: Climate Driver Discussion 2019 (Enso, IOD, PDO , SAM)
- Attachments
-
- EC 2308 00Z.jpg (360.49 KiB) Viewed 8889 times
- JasmineStorm
- Supercell
- Reactions:
- Posts: 1870
- Joined: Thu Sep 22, 2016 9:40 pm
- Location: Kyneton 527 ASL
Re: Climate Driver Discussion 2019 (Enso, IOD, PDO , SAM)
I'm keeping any eye on that one
-
Didjman

- Supercell
- Reactions:
- Posts: 2100
- Joined: Fri Sep 03, 2010 2:52 pm
- Location: Wallan, Vic 328m ASL
- Contact:
Re: Climate Driver Discussion 2019 (Enso, IOD, PDO , SAM)
Hence my question JS. Thx to your sharing of knowledge, I am starting to get a handle on things 
-
Didjman
- Supercell
- Reactions:
- Posts: 2100
- Joined: Fri Sep 03, 2010 2:52 pm
- Location: Wallan, Vic 328m ASL
- Contact:
Re: Climate Driver Discussion 2019 (Enso, IOD, PDO , SAM)
Is that chart / charts freely available?? If so I would like a link to bookmark for future reference pleaseJasmineStorm wrote: ↑Fri Aug 23, 2019 5:50 pmPolar vortex at 10 hPa is normally between -60c to -80c in August (you can see that in this attached shot). Latest EC is showing a large area over the South Pole above +0c including 4c. These are anomalies like I have never seen before on any chart.
- JasmineStorm
- Supercell
- Reactions:
- Posts: 1870
- Joined: Thu Sep 22, 2016 9:40 pm
- Location: Kyneton 527 ASL
Re: Climate Driver Discussion 2019 (Enso, IOD, PDO , SAM)
Sorry sir, it is paywalled. So you would need to join upDidjman wrote: ↑Fri Aug 23, 2019 6:19 pmIs that chart / charts freely available?? If so I would like a link to bookmark for future reference pleaseJasmineStorm wrote: ↑Fri Aug 23, 2019 5:50 pmPolar vortex at 10 hPa is normally between -60c to -80c in August (you can see that in this attached shot). Latest EC is showing a large area over the South Pole above +0c including 4c. These are anomalies like I have never seen before on any chart.
-
Didjman
- Supercell
- Reactions:
- Posts: 2100
- Joined: Fri Sep 03, 2010 2:52 pm
- Location: Wallan, Vic 328m ASL
- Contact:
Re: Climate Driver Discussion 2019 (Enso, IOD, PDO , SAM)
JS, I sent you a PMJasmineStorm wrote: ↑Fri Aug 23, 2019 6:29 pm
Sorry sir, it is paywalled. So you would need to join up
-
Didjman
- Supercell
- Reactions:
- Posts: 2100
- Joined: Fri Sep 03, 2010 2:52 pm
- Location: Wallan, Vic 328m ASL
- Contact:
Re: Climate Driver Discussion 2019 (Enso, IOD, PDO , SAM)
There is something strange going on at 10 Hpa. At 70Hpa, the 3 elongated vortices have air moving clockwise into them. At 10Hpa the winds are still clockwise but spiralling outwards like the top of a cyclone.
https://earth.nullschool.net/#current/w ... 91.86,1379
https://earth.nullschool.net/#current/w ... 91.86,2319
Also: https://wordpress.com/block-editor/post ... ress.com/4
for daily updates on the Eddy Heat Flux Anomaly sequence
https://earth.nullschool.net/#current/w ... 91.86,1379
https://earth.nullschool.net/#current/w ... 91.86,2319
Also: https://wordpress.com/block-editor/post ... ress.com/4
for daily updates on the Eddy Heat Flux Anomaly sequence
-
crikey

- Supercell
- Reactions:
- Posts: 1314
- Joined: Mon Feb 07, 2011 8:02 pm
- Location: tweed shire NSW and nDUNOLLY.. Nth Central district VIC
- Contact:
Re: Climate Driver Discussion 2019 (Enso, IOD, PDO , SAM)
I think that you will find if you zoom out you will see high pressure circulations on either side of the 10hPa layer.Didjman wrote: ↑Sat Aug 24, 2019 7:21 am There is something strange going on at 10 Hpa. At 70Hpa, the 3 elongated vortices have air moving clockwise into them. At 10Hpa the winds are still clockwise but spiralling outwards like the top of a cyclone.
https://earth.nullschool.net/#current/w ... 91.86,1379
https://earth.nullschool.net/#current/w ... 91.86,2319
Also: https://wordpress.com/block-editor/post ... ress.com/4
for daily updates on the Eddy Heat Flux Anomaly sequence
The wind streams leaving the perimeter are feeding in to these anti clockwise rotations.
During the the 2002 split,this was the case.Anti cyclones on either side of the central vortex.
However l have no idea if that arrangement is a common seasonal event.
-
crikey
- Supercell
- Reactions:
- Posts: 1314
- Joined: Mon Feb 07, 2011 8:02 pm
- Location: tweed shire NSW and nDUNOLLY.. Nth Central district VIC
- Contact:
Re: Climate Driver Discussion 2019 (Enso, IOD, PDO , SAM)
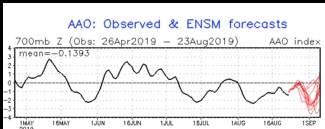
The AAO seems to be responding to the stratosphere temperature anomalies by remaining negative since July 4th 2019 and is forecasting another significant drop in the AAO this coming week into the first week of September.
That is now 51 days in the negative range
Might have to keep watching the stratosphere temp' anomalies , they seem to be highly correlated with the AAO with minimal time delay in response.
I might put that in my observation routine in the future
https://www.cpc.ncep.noaa.gov/products/ ... /aao.shtml
-
crikey
- Supercell
- Reactions:
- Posts: 1314
- Joined: Mon Feb 07, 2011 8:02 pm
- Location: tweed shire NSW and nDUNOLLY.. Nth Central district VIC
- Contact:
Re: Climate Driver Discussion 2019 (Enso, IOD, PDO , SAM)
Jetstream report.24th August 2019
The southern hemisphere jetstream pattern has changed from zonal sub tropical and weak sub polar in the winter of 2019 to a moderate meridonal wavy pattern for both jets. The sub polar jet still looks a bit weak
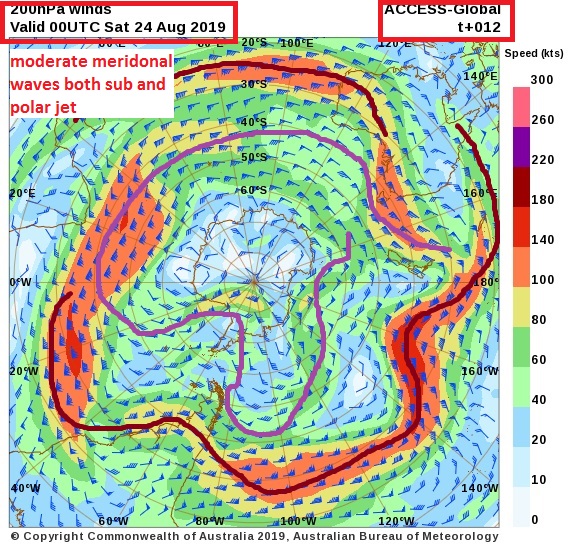
http://www.bom.gov.au/australia/charts/ ... fresh+View
The southern hemisphere jetstream pattern has changed from zonal sub tropical and weak sub polar in the winter of 2019 to a moderate meridonal wavy pattern for both jets. The sub polar jet still looks a bit weak
http://www.bom.gov.au/australia/charts/ ... fresh+View
-
Didjman
- Supercell
- Reactions:
- Posts: 2100
- Joined: Fri Sep 03, 2010 2:52 pm
- Location: Wallan, Vic 328m ASL
- Contact:
Re: Climate Driver Discussion 2019 (Enso, IOD, PDO , SAM)
We almost have a split at 10hpa:
https://earth.nullschool.net/#current/w ... 96.80,1379
https://earth.nullschool.net/#current/w ... 96.80,1379
-
Didjman
- Supercell
- Reactions:
- Posts: 2100
- Joined: Fri Sep 03, 2010 2:52 pm
- Location: Wallan, Vic 328m ASL
- Contact:
Re: Climate Driver Discussion 2019 (Enso, IOD, PDO , SAM)
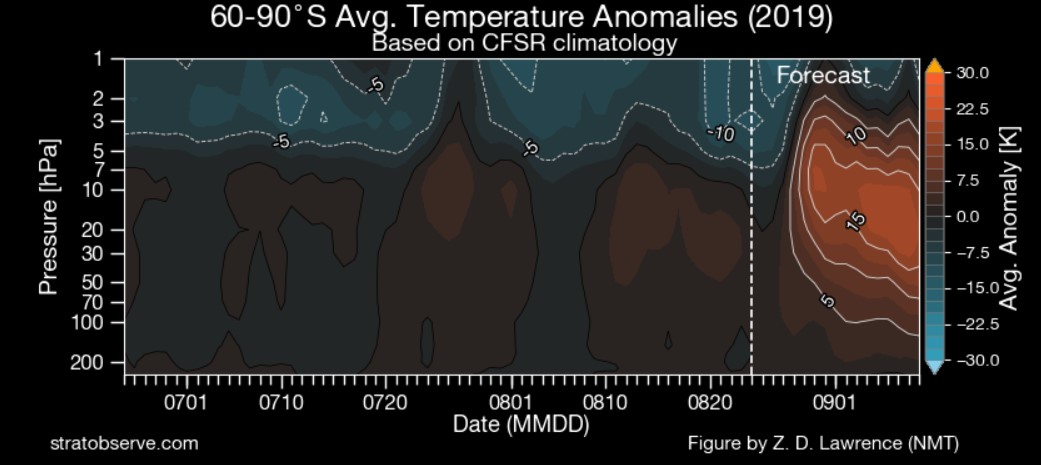
According to GFS modelling, the forecast ave temp anomalies from 01/09 are +25 Celsius from heights of 5 down to 50Hpa. This is for the stratosphere 60-90 degrees South. See the link to the graphic on my blog below:
https://didjman59.files.wordpress.com/2 ... 085118.jpg
https://didjman59.files.wordpress.com/2 ... 085118.jpg
-
crikey
- Supercell
- Reactions:
- Posts: 1314
- Joined: Mon Feb 07, 2011 8:02 pm
- Location: tweed shire NSW and nDUNOLLY.. Nth Central district VIC
- Contact:
Re: Climate Driver Discussion 2019 (Enso, IOD, PDO , SAM)
I can't see anything that resembles a split? atmDidjman wrote: ↑Sat Aug 24, 2019 7:21 pm We almost have a split at 10hpa:
https://earth.nullschool.net/#current/w ... 96.80,1379
Thanks for the temp' anomalies for polar stratosphere. That certainly looks intriguing.
-
Didjman
- Supercell
- Reactions:
- Posts: 2100
- Joined: Fri Sep 03, 2010 2:52 pm
- Location: Wallan, Vic 328m ASL
- Contact:
Re: Climate Driver Discussion 2019 (Enso, IOD, PDO , SAM)
Re split, it didn't last longcrikey wrote: ↑Sun Aug 25, 2019 9:21 amI can't see anything that resembles a split? atmDidjman wrote: ↑Sat Aug 24, 2019 7:21 pm We almost have a split at 10hpa:
https://earth.nullschool.net/#current/w ... 96.80,1379
Thanks for the temp' anomalies for polar stratosphere. That certainly looks intriguing.
The MJO still looks to be strong in our neck of the woods between Sept 7 - 11.
-
Didjman
- Supercell
- Reactions:
- Posts: 2100
- Joined: Fri Sep 03, 2010 2:52 pm
- Location: Wallan, Vic 328m ASL
- Contact:
Re: Climate Driver Discussion 2019 (Enso, IOD, PDO , SAM)
At 70hpa, back to 1 vortex, at 10 hpa back to an outward spiralling vortex(1600 local):
https://earth.nullschool.net/#current/w ... 91.29,1950
https://earth.nullschool.net/#current/w ... 91.29,1950
https://earth.nullschool.net/#current/w ... 91.29,1950
https://earth.nullschool.net/#current/w ... 91.29,1950
-
Didjman
- Supercell
- Reactions:
- Posts: 2100
- Joined: Fri Sep 03, 2010 2:52 pm
- Location: Wallan, Vic 328m ASL
- Contact:
Re: Climate Driver Discussion 2019 (Enso, IOD, PDO , SAM)
Not much change in the vortex at both 70 & 10 hpa. The heat anomaly forecast is still well up for early next month according to gfs.
Heat flux anomalies appear to be cascading while average heat anomalies are still high:
https://wordpress.com/block-editor/post ... ress.com/4
Is EC still forcasting +4c for 10hpa for end of month JS??
Heat flux anomalies appear to be cascading while average heat anomalies are still high:
https://wordpress.com/block-editor/post ... ress.com/4
Is EC still forcasting +4c for 10hpa for end of month JS??
- JasmineStorm
- Supercell
- Reactions:
- Posts: 1870
- Joined: Thu Sep 22, 2016 9:40 pm
- Location: Kyneton 527 ASL
-
Didjman
- Supercell
- Reactions:
- Posts: 2100
- Joined: Fri Sep 03, 2010 2:52 pm
- Location: Wallan, Vic 328m ASL
- Contact:
Re: Climate Driver Discussion 2019 (Enso, IOD, PDO , SAM)
Can you post the graphic pleaseJasmineStorm wrote: ↑Mon Aug 26, 2019 5:14 pmLatest EC run (00z) showing a pocket of +6c on Friday. Truly remarkable in recorded history.
- JasmineStorm
- Supercell
- Reactions:
- Posts: 1870
- Joined: Thu Sep 22, 2016 9:40 pm
- Location: Kyneton 527 ASL
Re: Climate Driver Discussion 2019 (Enso, IOD, PDO , SAM)
Latest EC upper Strat temperatures for Friday. +6c bubble inside the +4c contour line over the South Pole 
- Attachments
-
- EC 2608 10 hpa.jpg (351.83 KiB) Viewed 8440 times
-
Didjman
- Supercell
- Reactions:
- Posts: 2100
- Joined: Fri Sep 03, 2010 2:52 pm
- Location: Wallan, Vic 328m ASL
- Contact:
Re: Climate Driver Discussion 2019 (Enso, IOD, PDO , SAM)
Thx JS What is likely to happen to the vortex from that?? Split in 3??