
Welcome New Members! We want to hear from you. Register, stop lurking and start posting!
VIC - Warm and dry weather rolls on: April 17-30 2019
- Gordon
- Supercell
- Reactions:
- Posts: 2896
- Joined: Thu Jun 17, 2010 10:01 am
- Location: Near Gordon, Vic. 620 m asl
Re: Warm and dry weather rolls on: April 17-30?
Wow, interesting for context JS; thanks. My 'records' are quite puny by comparison.
- QldTwister
- Cumulonimbus
- Reactions:
- Posts: 434
- Joined: Tue May 22, 2012 7:56 pm
- Location: Ashwood Vic
Re: Warm and dry weather rolls on: April 17-30?
0.5mm here but we ok after 40mm from the 2 SWly bursts few weeks ago
The inland is just terrible and dire 5-10mm in the first 4 months of the year and no big rain in the coming 2 weeks which takes us to early May terrible for so much of SA VIc and NSW (though they getting good 30-50mm right now good on them)
The drought rolls on untill June or July i think.
The inland is just terrible and dire 5-10mm in the first 4 months of the year and no big rain in the coming 2 weeks which takes us to early May terrible for so much of SA VIc and NSW (though they getting good 30-50mm right now good on them)
The drought rolls on untill June or July i think.
Bring on the heat and stroms
- JasmineStorm
- Supercell
- Reactions:
- Posts: 1870
- Joined: Thu Sep 22, 2016 9:40 pm
- Location: Kyneton 527 ASL
Re: Warm and dry weather rolls on: April 17-30?
75 separate model runs across EC and GFS on the 12Z run are signalling a strong MJO phase into the eastern Indian Ocean at the start of May. If they verify, this will deliver increased moisture into any upper low that cuts off from polar region in the first 2 weeks of May. Show time seems to be getting closer 
- Attachments
-
- MJO 22 April.jpg (162.27 KiB) Viewed 11579 times
-
Rivergirl

- Memorial
- Reactions:
- Posts: 3674
- Joined: Sun Nov 22, 2009 6:04 pm
- Location: Ferny Creek VIC
- Contact:
Re: Warm and dry weather rolls on: April 17-30?
Wow JS I'm going to be in Mt Buffalo and Mt Hotham the first week of May 
- Tassiedave
- Supercell
- Reactions:
- Posts: 1101
- Joined: Thu Nov 11, 2010 11:09 am
- Location: Grindelwald Tasmania
Re: Warm and dry weather rolls on: April 17-30?
Today's temps in Tassie: Larapuna 21.3, Friendly Beaches 20.4, Fingal 20.3, Hobart 19.4, Launceston 19.3, St Helens 18.9
-
Didjman

- Supercell
- Reactions:
- Posts: 2100
- Joined: Fri Sep 03, 2010 2:52 pm
- Location: Wallan, Vic 328m ASL
- Contact:
Re: Warm and dry weather rolls on: April 17-30?
JS, have just googled it all to understand those charts (which I now do). I could only find the phase diagram for 12 Mar to 20 April on the BOM site. Have I missed something?
- snowfall
- Supercell
- Reactions:
- Posts: 1290
- Joined: Mon Mar 20, 2017 7:39 pm
- Location: Gisborne South (349m asl)
Re: Warm and dry weather rolls on: April 17-30?
That's interesting Jasmine. It's good to know we're not in unchartered territory, although I think we've suffered quite a lot this time due to the extreme heat in summer. I wonder what the picture will look like when we include April?JasmineStorm wrote: ↑Mon Apr 22, 2019 1:00 pm I actually had a look at BoM data recently on this long term topic at the nearest long term station to here, Malmsbury reservoir dating back to 1872. Here are the driest starts to the year in order. 2019 is currently 14th associated with this BoM data.
January to March
1882 - 6mm
1965 - 20mm
1967 - 22mm
1923 - 23mm
1892 - 27mm
2009 - 28mm
1879 - 31mm
1893 - 31mm
1986 - 34mm
1894 - 36mm
1992 - 37mm
1985 - 41mm
1997 - 41mm
2019 - 43mm (14th)
- snowfall
- Supercell
- Reactions:
- Posts: 1290
- Joined: Mon Mar 20, 2017 7:39 pm
- Location: Gisborne South (349m asl)
Re: Warm and dry weather rolls on: April 17-30?
Thanks Jasmine. A ray of hope!JasmineStorm wrote: ↑Mon Apr 22, 2019 2:18 pm 75 separate model runs across EC and GFS on the 12Z run are signalling a strong MJO phase into the eastern Indian Ocean at the start of May. If they verify, this will deliver increased moisture into any upper low that cuts off from polar region in the first 2 weeks of May. Show time seems to be getting closer
- JasmineStorm
- Supercell
- Reactions:
- Posts: 1870
- Joined: Thu Sep 22, 2016 9:40 pm
- Location: Kyneton 527 ASL
Re: Warm and dry weather rolls on: April 17-30?
The BoM's view is up until yesterday for MJO and not the model projection.
Here is the projected 16 day EC ensemble view link https://www.cpc.ncep.noaa.gov/products/ ... ecmm.shtml
Here is the projected 16 day GFS ensemble view link https://www.cpc.ncep.noaa.gov/products/ ... egfs.shtml
- JasmineStorm
- Supercell
- Reactions:
- Posts: 1870
- Joined: Thu Sep 22, 2016 9:40 pm
- Location: Kyneton 527 ASL
Re: Warm and dry weather rolls on: April 17-30?
If we have no more rain in April, it will go well into the top 10 since 1872 as some of those years had the Autumn break in April.
-
Didjman
- Supercell
- Reactions:
- Posts: 2100
- Joined: Fri Sep 03, 2010 2:52 pm
- Location: Wallan, Vic 328m ASL
- Contact:
Re: Warm and dry weather rolls on: April 17-30?
Thx for that JSJasmineStorm wrote: ↑Mon Apr 22, 2019 6:11 pm
The BoM's view is up until yesterday for MJO and not the model projection.
Here is the projected 16 day EC ensemble view link https://www.cpc.ncep.noaa.gov/products/ ... ecmm.shtml
Here is the projected 16 day GFS ensemble view link https://www.cpc.ncep.noaa.gov/products/ ... egfs.shtml

- Sean
- Supercell
- Reactions:
- Posts: 1000
- Joined: Mon Feb 27, 2012 6:35 pm
- Location: Patterson Lakes - SE Melb
Re: Warm and dry weather rolls on: April 17-30?
The 7-day outlook is looking great (temp-wise). Most days below 20c.. I think we're finally upon that 'shift' towards autumn-winter where the temps trend coolish instead of warmish.
Now we await the rain, I guess.
Re. the long term trends, is there data concerning high pressure ridges stretching back to the 19th Century?
One of the predicted consequences of climate change (for Australia at least) is expanding tropical regions, which, in turn, shift high pressure ridges to lower latitudes. If you look at the maps, much of the world's desert is found in similar latitudes because of the belts of high pressure. If those belts in the southern hemisphere shift downward, it means Victoria will be shielded against cold fronts.
I'm not drawing conclusions, but is the frequency and strength of cold fronts decreasing? Do we have data for that?
I think that's the only way we're ever going to know what 'normal' is or used to be. Because -- anecdotally -- it feels like cold fronts, most of the time, just seem to clip southern Victoria or hit Tasmania these days..
Re: Warm and dry weather rolls on: April 17-30?
It’s the same in SW WA too, May-July rainfall has reduced approximately 20% since 1970, the frequency of frost damage in the wheatbelt has increased too.
- StratoBendigo
- Supercell
- Reactions:
- Posts: 2818
- Joined: Fri Jan 02, 2015 2:18 pm
- Location: Kangaroo Flat
Re: Warm and dry weather rolls on: April 17-30?
It's looking pretty cold from Friday onwards. May 2-6 is shaping up for a cold outbreak too...
-
Didjman
- Supercell
- Reactions:
- Posts: 2100
- Joined: Fri Sep 03, 2010 2:52 pm
- Location: Wallan, Vic 328m ASL
- Contact:
Re: Warm and dry weather rolls on: April 17-30?
And thats when the MJO pulse is forecast to kick in. Hopefully some moisture gets dragged down in a NW cloudbandStratoBendigo wrote: ↑Tue Apr 23, 2019 5:09 pm It's looking pretty cold from Friday onwards. May 2-6 is shaping up for a cold outbreak too...
-
hillybilly

- Site Admin/Moderator
- Reactions:
- Posts: 5003
- Joined: Thu Nov 26, 2009 7:26 am
- Location: Howden Tasmania, 25m above sea level
- Contact:
Re: Warm and dry weather rolls on: April 17-30?
Bit of interest for tomorrow with the upper trough to our north getting dragged down into the westerlies. Should see some showers for most areas east of about Geelong to Bendigo. Looks like 2-5mm, but locally better around the northeast and higher Yarra Ranges.
Front for Friday also looking a bit better. Could well see locally 10-20mm in the favoured spots.
Btw the issue with our rain is not so much the dry spells, but the lack of sustained wet ones. We’ve always had droughts, but they used to be largely part of the boom and bust cycle which is normal in our climate as the IOD and ENSO lurch from wet to dry to wet. We’ve “lost” the the recovery booms. Droughts aren’t always properly broken. It’s most apparent in spots which depend most on the westerly rainfall. You can see this in the Vic annual rainfall with 18 below average, one average and three above average years since 1997. The three above average years were driven by extreme tropical influences 2010, 2011 and 2016.
- JasmineStorm
- Supercell
- Reactions:
- Posts: 1870
- Joined: Thu Sep 22, 2016 9:40 pm
- Location: Kyneton 527 ASL
Re: Warm and dry weather rolls on: April 17-30?
Going back to the Malmsbury reservoir BoM records example that dates back to 1872. Its annual mean is 720mm. The 20 years between 1884 to 1903, it only had 2 years that exceeded the annual mean. Over its 147 year history, it has only passed its mean 720mm around 40% of those years. This current pattern traces back nearly 150 years on this BoM data for us locally.hillybilly wrote: ↑Tue Apr 23, 2019 7:23 pm
Btw the issue with our rain is not so much the dry spells, but the lack of sustained wet ones. We’ve always had droughts, but they used to be largely part of the boom and bust cycle which is normal in our climate as the IOD and ENSO lurch from wet to dry to wet. We’ve “lost” the the recovery booms. Droughts aren’t always properly broken. It’s most apparent in spots which depend most on the westerly rainfall. You can see this in the Vic annual rainfall with 18 below average, one average and three above average years since 1997. The three above average years were driven by extreme tropical influences 2010, 2011 and 2016.
- Gordon
- Supercell
- Reactions:
- Posts: 2896
- Joined: Thu Jun 17, 2010 10:01 am
- Location: Near Gordon, Vic. 620 m asl
Re: Warm and dry weather rolls on: April 17-30?
On the topic of tomorrow's rain and HB's analysis (which makes sense to me) BOM Twitter have today posted this as an example of MetEye in action:
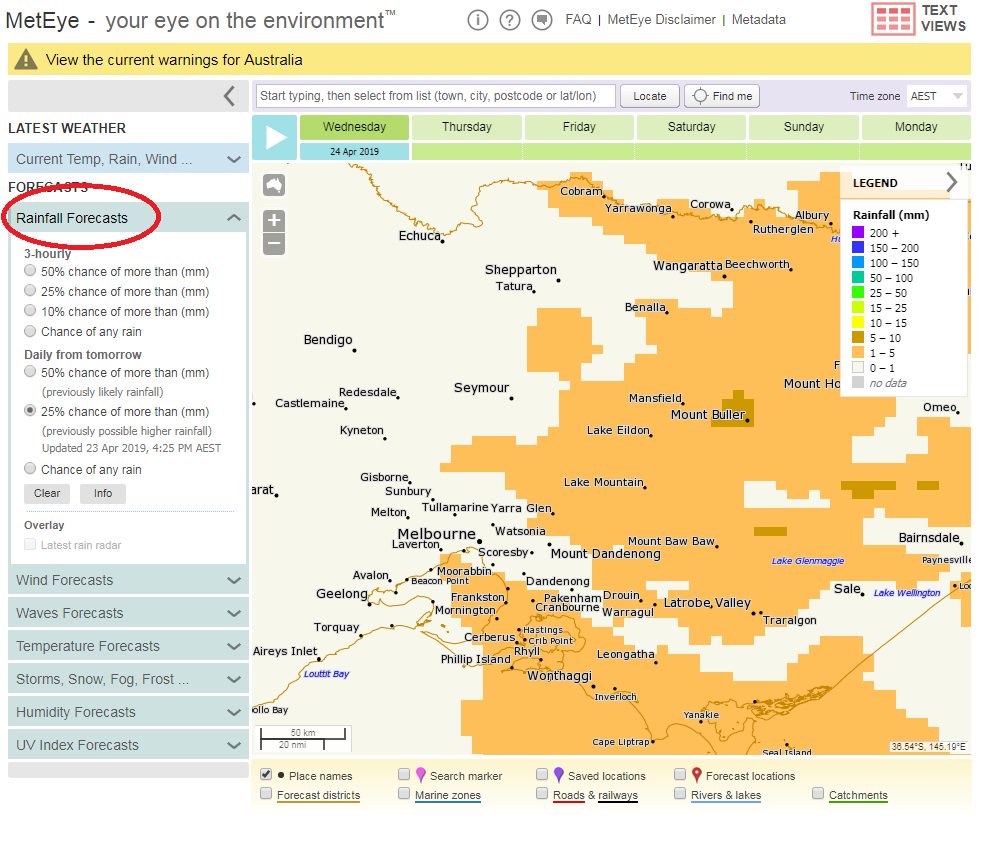
I struggle with MetEye's rainfall forecasts and this is a classic example. It's saying that for tomorrow, most of Melbourne and anywhere west, will miss out on any rain, and that's at the higher end of expectations! (25% chance.) Really???
I struggle with MetEye's rainfall forecasts and this is a classic example. It's saying that for tomorrow, most of Melbourne and anywhere west, will miss out on any rain, and that's at the higher end of expectations! (25% chance.) Really???
- Sean
- Supercell
- Reactions:
- Posts: 1000
- Joined: Mon Feb 27, 2012 6:35 pm
- Location: Patterson Lakes - SE Melb
Re: Warm and dry weather rolls on: April 17-30?
Cloudy today, but cool and almost cosy. Really not expecting any rain over the next 7 days. 'Possible showers' are generally tantamount to zilch. Very boring April indeed.
Do you know where I can find Melbourne's annual rainfall data going back to when records began? I want a list of every annual total from back then to now, as it would be interesting to see if there are any patterns, but I just can't seem to find it on BOM's website (not user friendly at all)JasmineStorm wrote: ↑Tue Apr 23, 2019 8:19 pmGoing back to the Malmsbury reservoir BoM records example that dates back to 1872. Its annual mean is 720mm. The 20 years between 1884 to 1903, it only had 2 years that exceeded the annual mean. Over its 147 year history, it has only passed its mean 720mm around 40% of those years. This current pattern traces back nearly 150 years on this BoM data for us locally.hillybilly wrote: ↑Tue Apr 23, 2019 7:23 pm
Btw the issue with our rain is not so much the dry spells, but the lack of sustained wet ones. We’ve always had droughts, but they used to be largely part of the boom and bust cycle which is normal in our climate as the IOD and ENSO lurch from wet to dry to wet. We’ve “lost” the the recovery booms. Droughts aren’t always properly broken. It’s most apparent in spots which depend most on the westerly rainfall. You can see this in the Vic annual rainfall with 18 below average, one average and three above average years since 1997. The three above average years were driven by extreme tropical influences 2010, 2011 and 2016.
-
hillybilly
- Site Admin/Moderator
- Reactions:
- Posts: 5003
- Joined: Thu Nov 26, 2009 7:26 am
- Location: Howden Tasmania, 25m above sea level
- Contact:
Re: Warm and dry weather rolls on: April 17-30?
Direct links at the URLs below. You can also use the interface at http://www.bom.gov.au/climate/data/Do you know where I can find Melbourne's annual rainfall data going back to when records began? I want a list of every annual total from back then to now, as it would be interesting to see if there are any patterns, but I just can't seem to find it on BOM's website (not user friendly at all)
http://www.bom.gov.au/jsp/ncc/cdio/weat ... _num=86071
http://www.bom.gov.au/jsp/ncc/cdio/weat ... num=086338
Just started to rain here. Was expecting it to start tomorrow. Satellite shows mid level cloud thickening southwards.